Hystrix参数配置
write by donaldhan, 2019-01-22 20:04引言
在微服务盛行的潮流下,如何在大流量访问的情况下,保证应用的可用性,防止级联失败,优雅降级,实时监控应用的健康状态,是大多数开发的关注的一个课题。 Hystrix在这个趋势下,应运而生。关于固定、滑动时间窗口限流算法,令牌桶、漏桶限流算法可以参考微服务接口限流的设计与思考。本文主要从功能上讨论Hystrix的如何限流, 以及参数如何使用。
目录
- What does it do?
- What Is Hystrix For
- What Design Principles Underlie Hystrix?
- Isolation
- Netflix DependencyCommand Implementation
- Circuit Breaker
- Request Collapsing
- Request Caching
- 配置策略测试
- 总结
What Is Hystrix For
Hystrix is designed to do the following:
- Give protection from and control over latency and failure from dependencies accessed (typically over the network) via third-party client libraries.
- Stop cascading failures in a complex distributed system.
- Fail fast and rapidly recover.
- Fallback and gracefully degrade when possible.
- Enable near real-time monitoring, alerting, and operational control.
What does it do?
- Latency and Fault Tolerance Stop cascading failures. Fallbacks and graceful degradation. Fail fast and rapid recovery.
Thread and semaphore isolation with circuit breakers.
- Realtime Operations Realtime monitoring and configuration changes. Watch service and property changes take effect immediately as they spread across a fleet.
Be alerted, make decisions, affect change and see results in seconds.
- Concurrency Parallel execution. Concurrency aware request caching. Automated batching through request collapsing.
This demo simulates 4 different HystrixCommand implementations with failures, latency, timeouts and duplicate calls in a multi-threaded environment.
It logs the results of HystrixRequestLog and metrics from HystrixCommandMetrics.
What Design Principles Underlie Hystrix?
Hystrix works by:
- Preventing any single dependency from using up all container (such as Tomcat) user threads.
- Shedding load and failing fast instead of queueing. 分流负载,快速失败取代排队。
- Providing fallbacks wherever feasible to protect users from failure.
- Using isolation techniques (such as bulkhead, swimlane, and circuit breaker patterns) to limit the impact of any one dependency. 使用隔离技术(隔离墙,泳道,熔断器)限制任一依赖的影响
- Optimizing for time-to-discovery through near real-time metrics, monitoring, and alerting
- Optimizing for time-to-recovery by means of low latency propagation of configuration changes and support for dynamic property changes in most aspects of Hystrix, which allows you to make real-time operational modifications with low latency feedback loops.
- Protecting against failures in the entire dependency client execution, not just in the network traffic.
Isolation
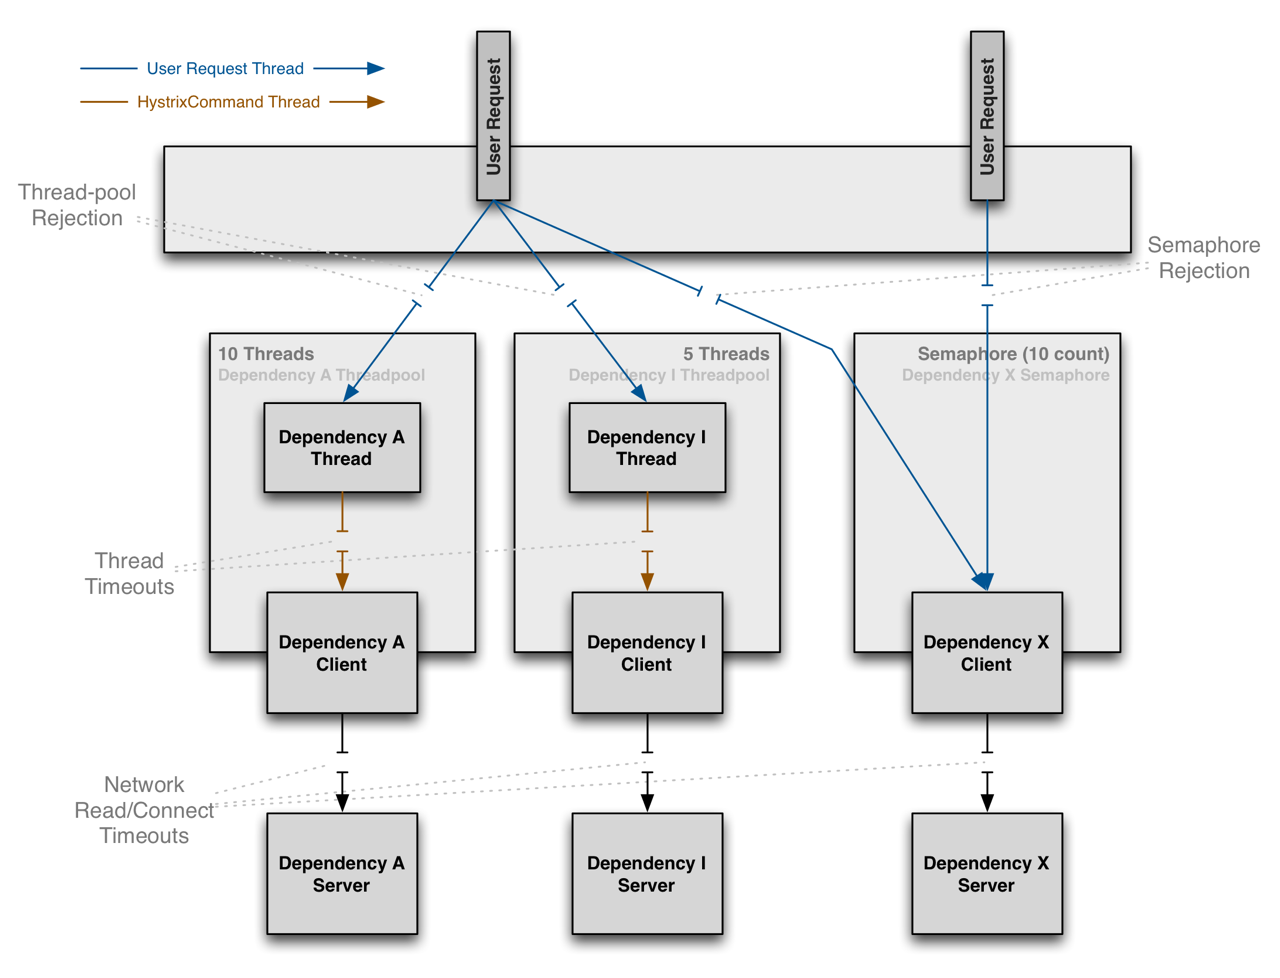
Hystrix employs the bulkhead pattern to isolate dependencies from each other and to limit concurrent access to any one of them.
Threads & Thread Pools
Clients (libraries, network calls, etc) execute on separate threads. This isolates them from the calling thread (Tomcat thread pool) so that the caller may “walk away” from a dependency call that is taking too long.
Hystrix uses separate, per-dependency thread pools as a way of constraining any given dependency so latency on the underlying executions will saturate the available threads only in that pool.
It is possible for you to protect against failure without the use of thread pools, but this requires the client being trusted to fail very quickly (network connect/read timeouts and retry configuration) and to always behave well.
Netflix, in its design of Hystrix, chose the use of threads and thread-pools to achieve isolation for many reasons including:
- Many applications execute dozens (and sometimes well over 100) different back-end service calls against dozens of different services developed by as many different teams.
- Each service provides its own client library.
- Client libraries are changing all the time.
- Client library logic can change to add new network calls.
- Client libraries can contain logic such as retries, data parsing, caching (in-memory or across network), and other such behavior.
- Client libraries tend to be “black boxes” — opaque to their users about implementation details, network access patterns, configuration defaults, etc.
- In several real-world production outages the determination was “oh, something changed and properties should be adjusted” or “the client library changed its behavior.”
- Even if a client itself doesn’t change, the service itself can change, which can then impact performance characteristics which can then cause the client configuration to be invalid.
- Transitive dependencies can pull in other client libraries that are not expected and perhaps not correctly configured.
- Most network access is performed synchronously.
- Failure and latency can occur in the client-side code as well, not just in the network call.
Benefits of Thread Pools
The benefits of isolation via threads in their own thread pools are:
- The application is fully protected from run away client libraries. The pool for a given dependency library can fill up without impacting the rest of the application.
- The application can accept new client libraries with far lower risk. If an issue occurs, it is isolated to the library and doesn’t affect everything else.
- When a failed client becomes healthy again, the thread pool will clear up and the application immediately resumes healthy performance, as opposed to a long recovery when the entire Tomcat container is overwhelmed.
- If a client library is misconfigured, the health of a thread pool will quickly demonstrate this (via increased errors, latency, timeouts, rejections, etc.) and you can handle it (typically in real-time via dynamic properties) without affecting application functionality.
- If a client service changes performance characteristics (which happens often enough to be an issue) which in turn cause a need to tune properties (increasing/decreasing timeouts, changing retries, etc.) this again becomes visible through thread pool metrics (errors, latency, timeouts, rejections) and can be handled without impacting other clients, requests, or users.
- Beyond the isolation benefits, having dedicated thread pools provides built-in concurrency which can be leveraged to build asynchronous facades on top of synchronous client libraries (similar to how the Netflix API built a reactive, fully-asynchronous Java API on top of Hystrix commands).
- In short, the isolation provided by thread pools allows for the always-changing and dynamic combination of client libraries and subsystem performance characteristics to be handled gracefully without causing outages.
Note: Despite the isolation a separate thread provides, your underlying client code should also have timeouts and/or respond to Thread interrupts so it can not block indefinitely and saturate the Hystrix thread pool.
建议使用配置线程池方式,可以隔离调用失败对整个容器和应用的影响。
Drawbacks of Thread Pools
The primary drawback of thread pools is that they add computational overhead. Each command execution involves the queueing, scheduling, and context switching involved in running a command on a separate thread.
Netflix, in designing this system, decided to accept the cost of this overhead in exchange for the benefits it provides and deemed it minor enough to not have major cost or performance impact.
使用线程池的劣势,因为需要维护请求队列,调度,和上线文切换,及使用独立的线程,处理请求,会增加负载,但Netflix相信,消耗负载带来的益处远大于带来的负载弊端。同时 Netflix最小化负载的消耗,对主性能和负载没有影响。
Semaphores
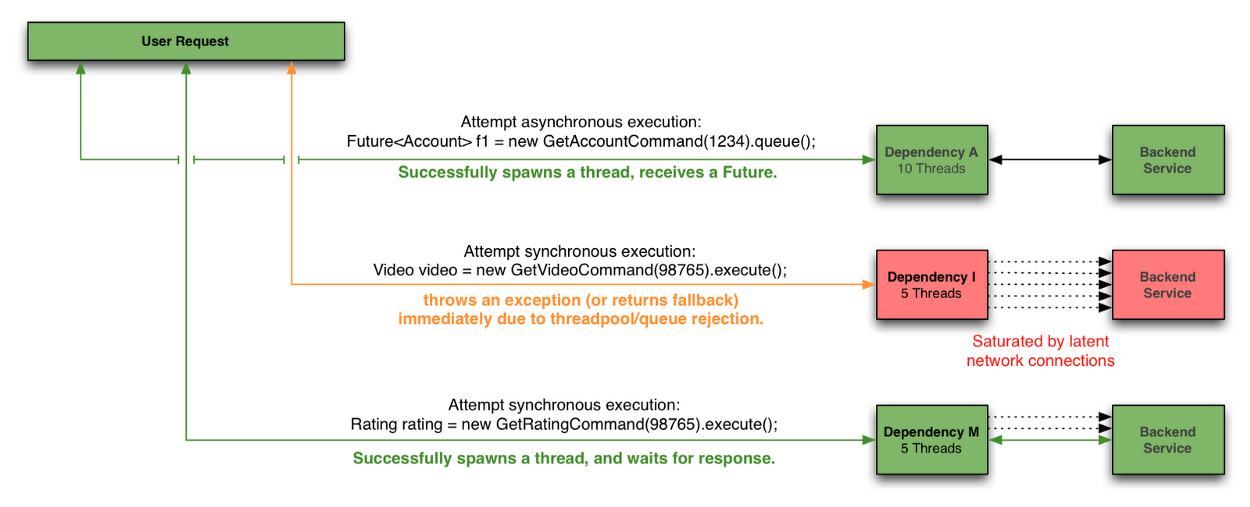
You can use semaphores (or counters) to limit the number of concurrent calls to any given dependency, instead of using thread pool/queue sizes. This allows Hystrix to shed load without using thread pools but it does not allow for timing out and walking away. If you trust the client and you only want load shedding, you could use this approach.
HystrixCommand and HystrixObservableCommand support semaphores in 2 places:
- Fallback: When Hystrix retrieves fallbacks it always does so on the calling Tomcat thread.
- Execution: If you set the property execution.isolation.strategy to SEMAPHORE then Hystrix will use semaphores instead of threads to limit the number of concurrent parent threads that invoke the command. You can configure both of these uses of semaphores by means of dynamic properties that define how many concurrent threads can execute. You should size them by using similar calculations as you use when sizing a threadpool (an in-memory call that returns in sub-millisecond times can perform well over 5000rps with a semaphore of only 1 or 2 … but the default is 10).
Note: if a dependency is isolated with a semaphore and then becomes latent, the parent threads will remain blocked until the underlying network calls timeout.
Semaphore rejection will start once the limit is hit but the threads filling the semaphore can not walk away.
信号量也可以控制并发,但是没有超时的熔断条件。如果你相信依赖的应用或更在乎负载,则可以使用信号量控制并发。
Netflix DependencyCommand Implementation
The service-oriented architecture at Netflix allows each team freedom to choose the best transport protocols and formats (XML, JSON, Thrift, Protocol Buffers, etc) for their needs so these approaches may vary across services.
In most cases the team providing a service also distributes a Java client library.
Because of this, applications such as API in effect treat the underlying dependencies as 3rd party client libraries whose implementations are “black boxes”. This in turn affects how fault tolerance is achieved.
In light of the above architectural considerations we chose to implement a solution that uses a combination of fault tolerance approaches:
- network timeouts and retries
- separate threads on per-dependency thread pools
- semaphores (via a tryAcquire, not a blocking call)
- circuit breakers
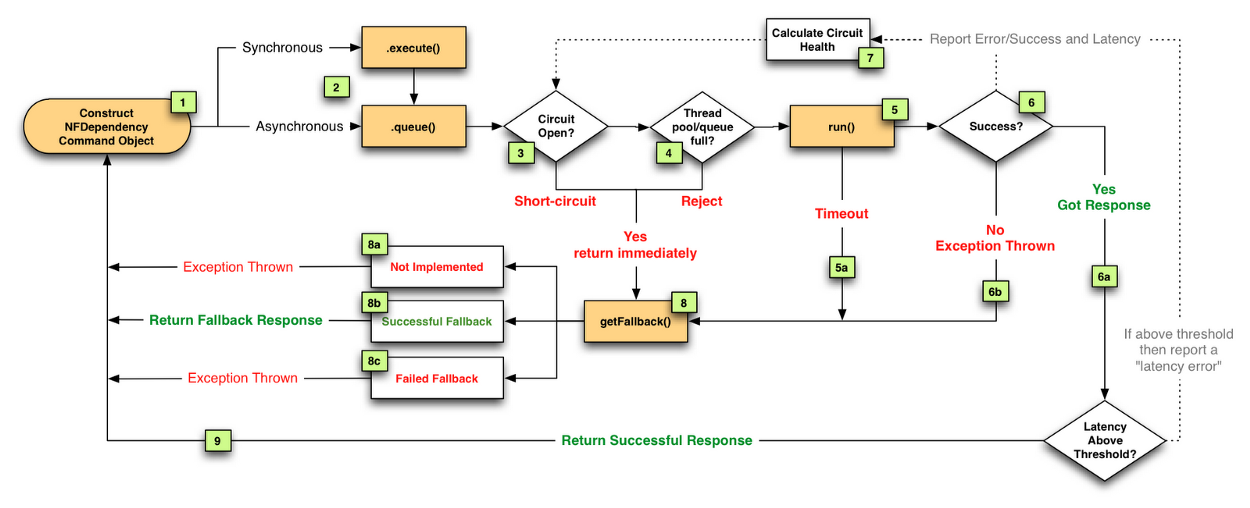
he Netflix DependencyCommand implementation wraps a network-bound dependency call with a preference towards executing in a separate thread and defines fallback logic which gets executed (step 8 in flow chart below) for any failure or rejection (steps 3, 4, 5a, 6b below) regardless of which type of fault tolerance (network or thread timeout, thread pool or semaphore rejection, circuit breaker) triggered it.
Semaphores are used instead of threads for dependency executions known to not perform network calls (such as those only doing in-memory cache lookups) since the overhead of a separate thread is too high for these types of operations.
We also use semaphores to protect against non-trusted fallbacks. Each DependencyCommand is able to define a fallback function (discussed more below) which is performed on the calling user thread and should not perform network calls. Instead of trusting that all implementations will correctly abide to this contract, it too is protected by a semaphore so that if an implementation is done that involves a network call and becomes latent, the fallback itself won’t be able to take down the entire app as it will be limited in how many threads it will be able to block.
使用场景:对负载要求较高,对延迟要求不高的高。请求高延时
Circuit Breaker
The following diagram shows how a HystrixCommand or HystrixObservableCommand interacts with a HystrixCircuitBreaker and its flow of logic and decision-making, including how the counters behave in the circuit breaker.
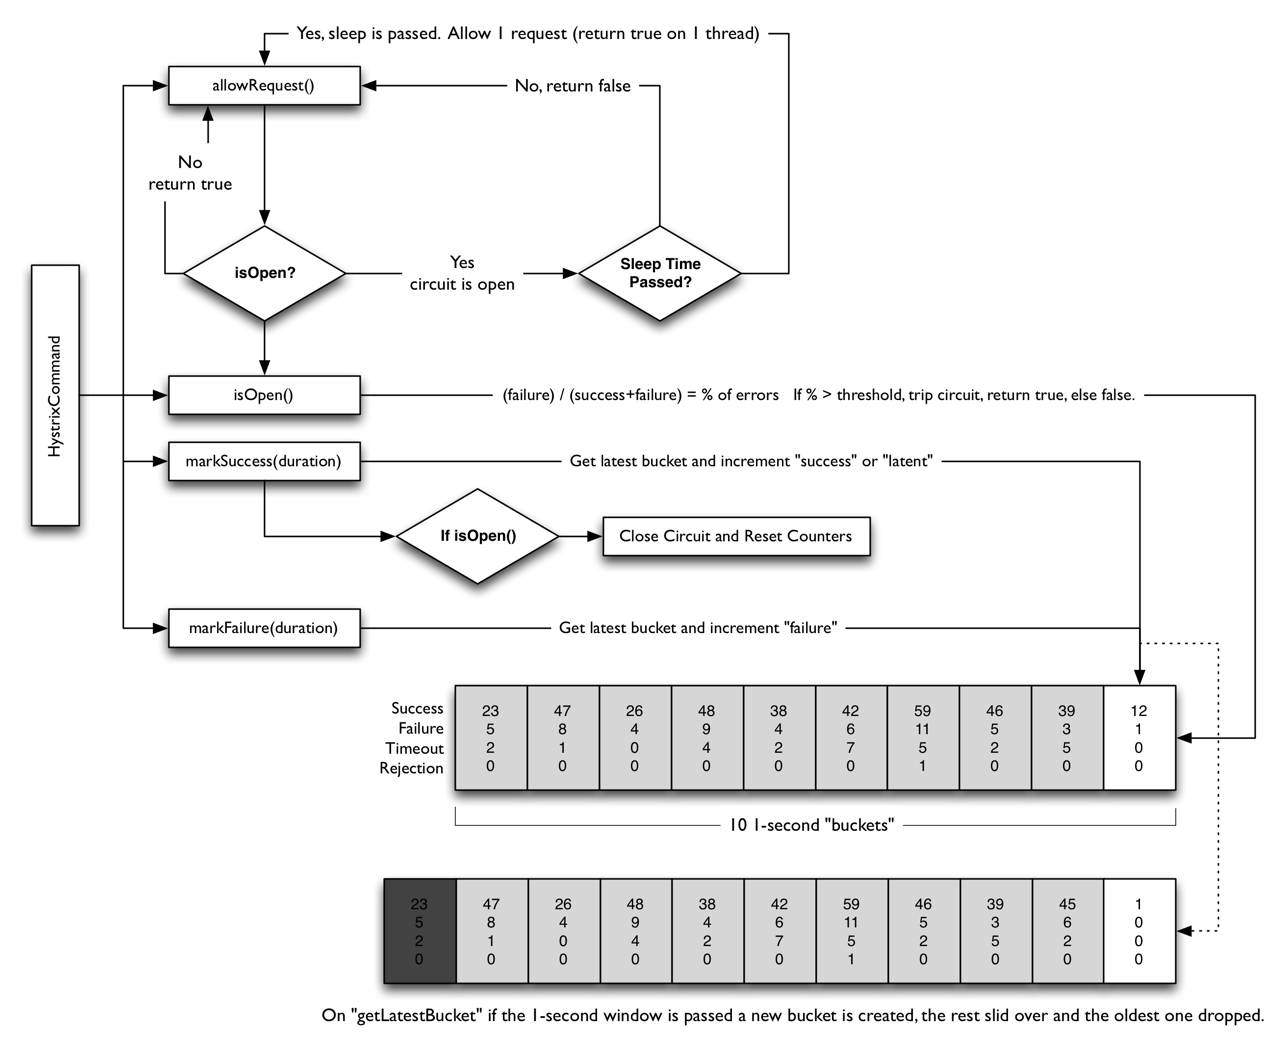
The precise way that the circuit opening and closing occurs is as follows:
- Assuming the volume across a circuit meets a certain threshold (HystrixCommandProperties.circuitBreakerRequestVolumeThreshold())… 在熔断器统计时间窗口(默认10s)内,达到请求阈值默认(20个)
- And assuming that the error percentage exceeds the threshold error percentage (HystrixCommandProperties.circuitBreakerErrorThresholdPercentage())… 在统计窗口时间之前,错误率达到错误阈值,默认50%
- Then the circuit-breaker transitions from CLOSED to OPEN. 如果达到1,2条件,则将会触发熔断,并睡眠一定的时间,默认为5s。
- While it is open, it short-circuits all requests made against that circuit-breaker.
- After some amount of time (HystrixCommandProperties.circuitBreakerSleepWindowInMilliseconds()), the next single request is let through (this is the HALF-OPEN state). If the request fails, the circuit-breaker returns to the OPEN state for the duration of the sleep window. If the request succeeds, the circuit-breaker transitions to CLOSED and the logic in 1. takes over again. 如果熔断触发,睡眠给定的时间后,熔断器关闭,新进的请求,将会通过,如果请求失败,则重新触发熔断,并随眠给定的时间。
如果以上五步都没有问题的情况下,再去检查线程池和信号量的配置。
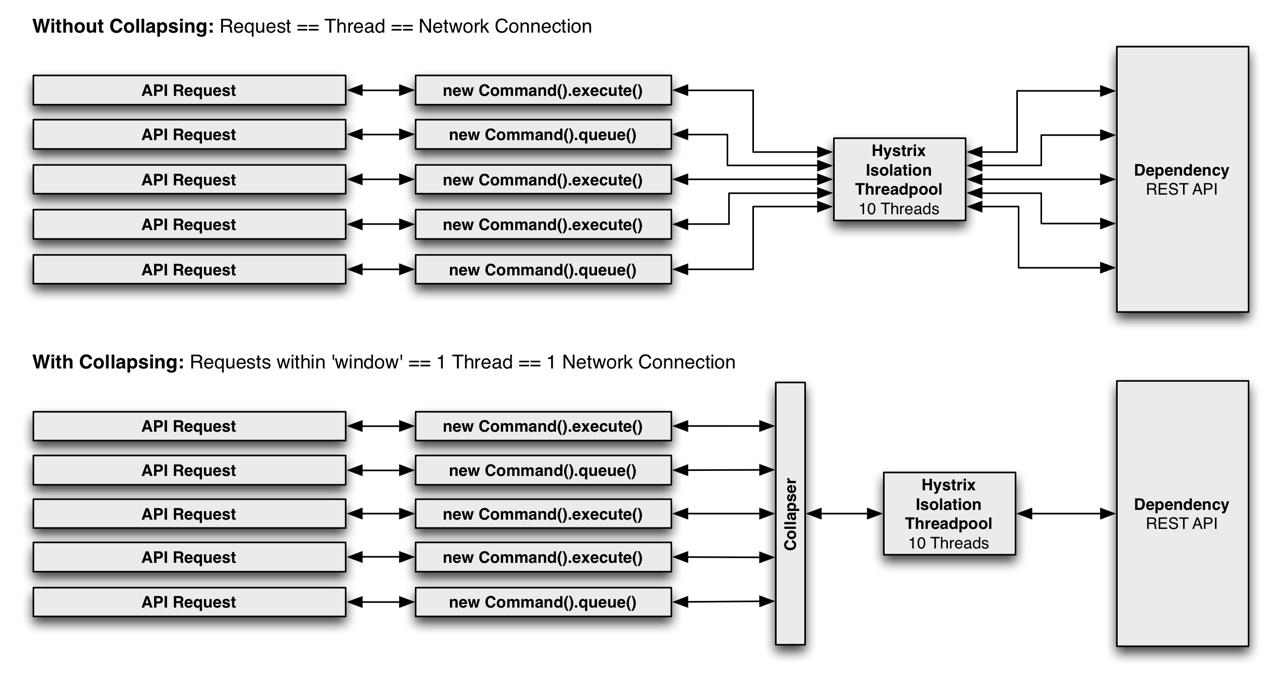
Request Collapsing
Concept
Request Collapsing enables many concurrent requests, on an external service, to be batched together into one request.
For example if a user wanted to load bookmarks for 300 video objects, rather than performing 300 network calls against a web service, these requests could be batched into one request.
Requests can be Collapsed around, the batch size and elapsed time since the batch started.
Advantages/Disadvantages
Advantages
Reduces the number of threads and network connections needed to perform requests Reduces the load on the external service
Disadvantages
An increased latency before the actual command is executed. The maximum cost is the size of the batch window Example
The following example is taken from: Hystrix - Request Collapsing. With a slight modification, the batch size window has been increased to 2 seconds.
The example demonstrates four concurrent calls being performed, and shows how the four concurrent requests are batched together.
The following visualization shows just the first two calls, to keep the example concise.
具体时序图,可以参考: https://design.codelytics.io/hystrix/request-collapsing
HystrixCollapser请求合并相关参数,如下:
- Collapser Properties:用来控制命令合并相关的行为。
- maxRequestsInBatch:该参数用来设置一次请求合并批处理中允许的最大请求数。
- timerDelayInMilliseconds:用来设置批处理过程中每个命令延迟的时间,单位为毫秒,默认值为10。
- requestCache.enabled:设置批处理过程中是否开启请求缓存。
Request Caching
HystrixCommand and HystrixObservableCommand implementations can define a cache key which is then used to de-dupe calls within a request context in a concurrent-aware manner.
The Hystrix RequestCache will execute the underlying run() method once and only once, and both threads executing the HystrixCommand will receive the same data despite having instantiated different instances.
-
Data retrieval is consistent throughout a request. Instead of potentially returning a different value (or fallback) each time the command is executed, the first response is cached and returned for all subsequent calls within the same request.
-
Eliminates duplicate thread executions. Since the request cache sits in front of the construct() or run() method invocation, Hystrix can de-dupe calls before they result in thread execution.
If Hystrix didn’t implement the request cache functionality then each command would need to implement it themselves inside the construct or run method, which would put it after a thread is queued and executed.
请求缓存在run()和construce()执行之前生效,所以可以有效减少不必要的线程开销。你可以通过实现getCachekey()方法来开启请求缓存。
请求缓存使用如下:
| 注解 | 描述 | 属性 |
|---|---|---|
| @CacheResult | 改注解用来标记请求命令返回的结果应该被缓存,它必须与@HystrixCommand注解结合使用 | cacheKeyMethode |
| @CacheRemove | 该注解用来让请求命令的缓存失效,失效的缓存根据定义的key决定 | commandKey,cacheKeyMethod |
| @CacheKey | 改注解用来在请求命令的参数上标记,使其作为缓存的Key值,如果没有标注则会使用所有参数。如果同时还使用了@CacheResult和@CacheRemove注解的cacheKeyMethod方法指定缓存Key的生成,那么该注解将不会起作用 | value |
如何配置
The pool should be sized large enough to handle normal healthy traffic but small enough that it will constrain concurrent execution if backend calls become latent.
For more information see the Github Wiki: https://github.com/Netflix/Hystrix/wiki/Configuration#wiki-ThreadPool and https://github.com/Netflix/Hystrix/wiki/How-it-Works#wiki-Isolation
Global default from code<Dynamic global default property<Instance default from code<Dynamic instance property
优先级依次递增: 全局默认值< 动态配置全局默认属性< 代码层实例配置< 动态实例配置
Command属性
Command Properties
Execution
 execution.isolation.strategy
 THREAD,SEMAPHORE ,默认为线程隔离策略,强烈建议使用线程隔离策略,线程策略可以避免网络超时带来的请求延时。针对没有网络请求和每秒有大量请求,并且每个请求线程的负载较高的情况下,可以使用信号量策略。信号量执行策略没有超时检查。
 execution.isolation.thread.timeoutInMilliseconds
 隔离线程执行超时时间,默认为1000ms。超时则执行fallback。
 execution.timeout.enabled
 是否执行线程执行超时检查,默认为true
 execution.isolation.thread.interruptOnTimeout
 线程执行超时,是否中断执行run
 execution.isolation.thread.interruptOnCancel
 线程执行请求取消是,是否中断线程,默认为false。
 execution.isolation.semaphore.maxConcurrentRequests
 信号量执行策略下,允许的并发请求数,默认为10/s,理论上讲,应该是为容器线程池的线程数,从隔离的原则上来说,建议为线程池数量的小部分。官方给出的参考为,内存级的度量数据请求,2个信号量,可以处理5000rps    Fallback    此配置使用线程和信号量两种隔离策略

 fallback.isolation.semaphore.maxConcurrentRequests
 同时降级的最大并发量,默认为10
 fallback.enabled
 执行失败,或拒绝执行发生时,是否调用降级方法,默认为true,false,则抛出Hystrix运行时异常    Circuit Breaker

 circuitBreaker.enabled
 针对请求处理失败,是否短路,追踪应用健康状况
 circuitBreaker.requestVolumeThreshold
 在一个滑动窗口内,开启熔断器检查统计条件,默认为20/10s。需要注意,如果在十秒内,有19个请求,都出现错误,也不会,触发熔断。
 circuitBreaker.sleepWindowInMilliseconds
 触发熔断器后,等待关闭熔断器的时间,默认为5000s。
 circuitBreaker.errorThresholdPercentage
 在一个统计窗口内,达到错误百分比时,触发熔断,默认为50%,主要看我们对错误民不敏感,如果敏感可以设置10%。
 circuitBreaker.forceOpen
 强制打开熔断器,拒绝所有请求,默认为false
 circuitBreaker.forceClosed
 强制关闭熔断器,忽略错误百分比,当期circuitBreaker.forceOpen配置为true,此配置忽略    Metrics

   metrics.rollingStats.timeInMilliseconds
   一个滑动度量窗口的时间,默认为10s
   metrics.rollingStats.numBuckets
   一个滑动窗口内,统计桶的数量,默认为10;这样做的目的是将滑动窗口分为多个小的统计小窗口,防止统计数据的丢失。需要注意metrics.rollingStats.timeInMilliseconds % metrics.rollingStats.numBuckets == 0,否则将会抛出异常。
   metrics.rollingPercentile.enabled
   请求延时统计(mean, percentiles),默认为true,没有则为-1
   metrics.rollingPercentile.timeInMilliseconds
   延时统计滑动窗口时间,默认为60s
   metrics.rollingPercentile.numBuckets
   延时统计窗口内的桶数,默认为6, 需要注意metrics.rollingPercentile.timeInMilliseconds % metrics.rollingPercentile.numBuckets == 0,否则将会抛出异常。
   metrics.rollingPercentile.bucketSize
   每个桶内的请求数,默认为100,如果在一个延时统计窗口的桶内,数量大于桶size,则将开一个新的桶。
   metrics.healthSnapshot.intervalInMilliseconds
   度量间隔,用户统计错误,成功错误请求的百分比,统计结果将用于是否触发熔断(错误百分比),默认为500ms    Request Context

 requestCache.enabled
 是否使用请求缓存key,默认true
 requestLog.enabled
 是否开启命令执行,时间日志,默认为true  Collapser Properties

 maxRequestsInBatch
 允许批量处理的数量,默认为Integer.MAX_VALUE
 timerDelayInMilliseconds
 创建批请求后,执行批请求的等待时间,默认为10ms
 requestCache.enabled
 是否开启请求缓存  Thread Pool Properties  配置的属性与线程池的属性基本相同。

 coreSize
 线程池核心线程池大小,默认为10
 maximumSize
 最大线程池,此参数生效,必须allowMaximumSizeToDivergeFromCoreSize为true,默认为10
 maxQueueSize
 阻塞任务队列的大小,配置为正数是LinkedBlockingQueue,-1为SynchronousQueue。注意:此于队列实现不能重新调整大小,参数只用于任务的初始化,针对线程池执行器不能重新初始化的,也不支持重新调整大小。如果克服上线的限制,可以使用queueSizeRejectionThreshold。默认为-1.
 queueSizeRejectionThreshold
 队列拒绝阈值,在未到达队列容量时,任务数量达到阈值,则拒绝执行,默认为5;之所以设置这个属性的原因,队列容量一旦设置,不可修改。如果maxQueueSize == -1,此配置无效。
 keepAliveTimeMinutes
 当前,coresize<maximumSize时,默认为1;空闲线程的释放等待的时间。
 allowMaximumSizeToDivergeFromCoreSize
 此配置允许,maximumSize>coreSize, 默认为false
 metrics.rollingStats.timeInMilliseconds
 线程次metric,滑动窗口,默认为10s
 metrics.rollingStats.numBuckets
 滑动窗口内的桶数量,默认为10。需要注意metrics.rollingStats.timeInMilliseconds % metrics.rollingStats.numBuckets == 0,否则将会抛出异常。
大部分情况下,默认10个线程变现已经很不错,实际上可以更小。如果线程池需要调大,则可以根据以下公式: (峰值每秒的请求数*健康状况下99%的响应时间+缓冲空间) 一般原则,线程越小越好,因为线程池,承担着负载分流和控制延迟阻塞资源的消耗。
线程池大小的理论基础为队列理论,利特尔法则;
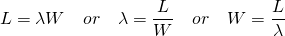
https://blog.bramp.net/post/2015/12/17/the-importance-of-tuning-your-thread-pools/
Queuing theory, in particular, Little’s Law, can be used to help understand the properties of the thread pool. In simple terms, Little’s Law describes the relationship between three variables; L the number of requests in-flight, λ the rate at which new requests arrive, and W the average time to handle the request.
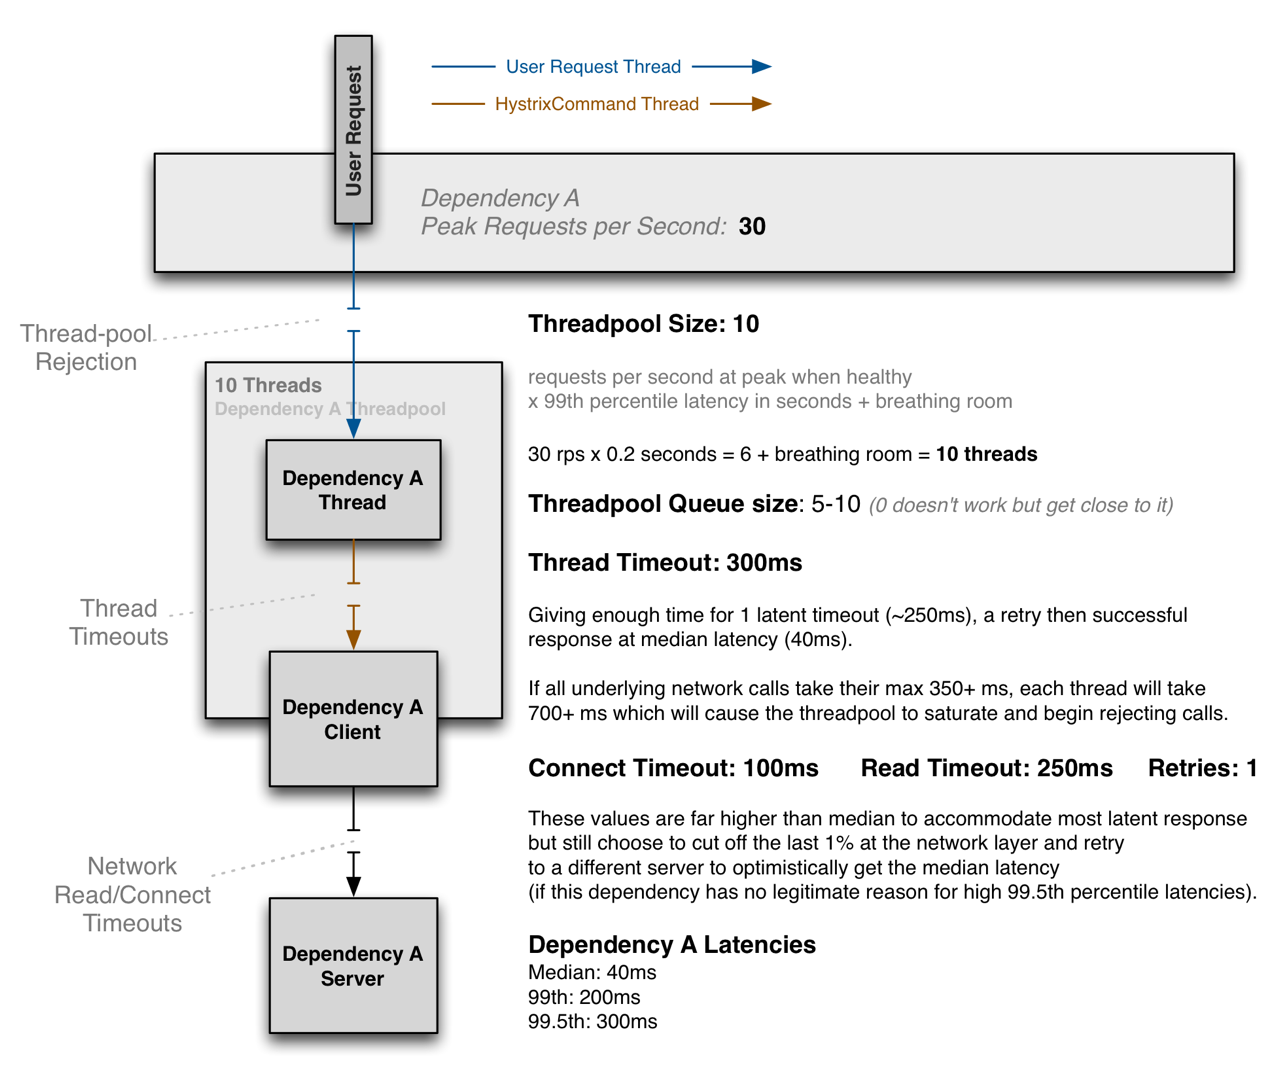
在一个每秒为30RPS,耗时0.2ms的情况下,设置线程池为30*0.2=6为核心线程池,最大线程数为10;假设请求A延迟的中位数为40ms,99%为200ms,99.5%为300ms,如果在依赖A客户端超时的过程中,延迟为250ms,客户端A到服务A的RT为350ms(连接时间100ms+读数据时间250ms),我们超时时间设为300ms的话,我们牺牲掉最后1%的请求,但可以在300ms内完成大多数的请求。
10个线程处理99%的请求,在监控健康的情况下,一两个活跃的线程可以服务中位数的请求。当我们很难准确的配置处理超时时间,可以保护处网络延迟之外的时间影响场景。如果我们降级掉最后一层网络的timeout的请求,大部分情况下,可以达到中位数的响应时间,如果同时可以在300ms内完成所有请求。
我们合理的timeout设置应该为300ms,也就是99.5%的访问延时,计算方法是,因为判断每次访问延时最多在250ms(TP99如果是200ms的话),再加一次重试时间50ms,就是300ms,感觉也应该足够了
不同的场景和应用,有不同的tradeoffs方案。
如果在真是环境中,如果配置失效,可以动态的调整配置参数。
在讨论线程池和线程队列之前,我们先看一下:ThreadPoolExecutor关键点
ThreadPoolExecutor
当前任务提交时,如果线程没有达到核心size,即使有其他空闲线程,则创建一个线程。对于工作线程大于coresize,但小于maximumPoolSize,首先将任务添加到队列,直到任务队列满时,才创建线程;keepAliveTime运行大于coreSize的空闲线程,保活时间。
即当线程池中的线程数大于corePoolSize时,如果一个线程空闲的时间达到keepAliveTime,则会终止,直到线程池中的线程数不超过corePoolSize。 allowCoreThreadTimeOut默认是false,即核心线程不会超时关闭,除非手动关闭线程池才会销毁线程。
针对两种任务队列SynchronousQueue和LinkedBlockingQueue
SynchronousQueue
每一插入操作,必须对应一个remove操作。 消费者没拿走当前的产品,生产者是不能再给产品的。应该是为了保证消费者和生产者的节奏一致吧,其它的队列实际上有缓存的意思,比如说消费者在高峰期消费不了那么多,那么队列会缓存一部分产品,这样就不至于影响生产者的速度。
LinkedBlockingQueue
可以扩展,但是我们可以使用queueSizeRejectionThreshold来动态控制队列大小。
线程池队列大小的配置是一个难题?我们引用JDK中线程池类,
ArrayBlockingQueue helps prevent resource exhaustion when used with finite maximumPoolSizes, but can be more difficult to tune and control. Queue sizes and maximum pool sizes may be traded off for each other: Using large queues and small pools minimizes CPU usage, OS resources, and context-switching overhead, but can lead to artificially low throughput. If tasks frequently block (for example if they are I/O bound), a system may be able to schedule time for more threads than you otherwise allow. Use of small queues generally requires larger pool sizes, which keeps CPUs busier but may encounter unacceptable scheduling overhead, which also decreases throughput.
限制线程池队列的大小,可以防止资源被耗尽,但是很对控制和调整。队列大小和最大线程池size两者 可以取一个traded off,使用大队列,小线程池可以最小化CPU的使用,及资源消耗,上线文切换负载,将导致吞吐量降低。 如果任务是IO密集型的,系统也许可以调度比设置的线程更多的线程。一般情况下,使用容量小的队列,需要一个 更大的线程池size,这样可以保证CPU处于忙碌状态,但是会遇到不可接受的调度负载,也会降低吞度量。
按照上面的描述,是不是的最大队列和和最大线程数相同?
配置策略测试
本部分的所有测试环境如下:
硬件环境为:Debian GNU/Linux 8
软件环境为:,cpu 4核,内存为8G,tomcat8,JDK8,apache-jmeter-4.0
虚拟机参数:-Xms4096m -Xmx4096m -XX:MaxPermSize=128m
接口原始性能测试
我们设置所有压测,持续时间为5分钟。 首先我们用200并发压测,压测数据如下:
summary = 151716 in 00:03:02 =  835.8/s Avg:   235 Min:     9 Max:  2292 Err:     0 (0.00%)
summary +  26221 in 00:00:30 =  874.0/s Avg:   228 Min:     9 Max:  1487 Err:     0 (0.00%) Active: 200 Started: 200 Finished: 0
summary = 177937 in 00:03:32 =  841.2/s Avg:   234 Min:     9 Max:  2292 Err:     0 (0.00%)
summary +  27316 in 00:00:30 =  910.5/s Avg:   219 Min:    10 Max:  1239 Err:     0 (0.00%) Active: 200 Started: 200 Finished: 0
summary = 205253 in 00:04:02 =  849.8/s Avg:   232 Min:     9 Max:  2292 Err:     0 (0.00%)
summary +  26040 in 00:00:30 =  868.0/s Avg:   230 Min:    11 Max:  1278 Err:     0 (0.00%) Active: 200 Started: 200 Finished: 0
summary = 231293 in 00:04:32 =  851.8/s Avg:   232 Min:     9 Max:  2292 Err:     0 (0.00%)
summary +  25168 in 00:00:29 =  876.8/s Avg:   228 Min:    10 Max:  1449 Err:     0 (0.00%) Active: 0 Started: 200 Finished: 200
summary = 256461 in 00:05:00 =  854.2/s Avg:   231 Min:     9 Max:  2292 Err:     0 (0.00%)
summary + 为每次的请求统一,summary = 为累计统计,最后一行为summary = 为最终的统计。 我们来看200并发的最后一行,总共请求256461s, 支持的最大tps为854.2/s,平均耗时231ms,最小9ms,最大2292秒。
我们再用300并发,压测数据如下:
summary +  26407 in 00:00:30 =  880.3/s Avg:   340 Min:    15 Max:  1424 Err:     0 (0.00%) Active: 300 Started: 300 Finished: 0
summary = 135798 in 00:02:36 =  869.3/s Avg:   338 Min:    10 Max:  1888 Err:     0 (0.00%)
summary +  25658 in 00:00:30 =  855.2/s Avg:   351 Min:    10 Max:  1534 Err:     0 (0.00%) Active: 300 Started: 300 Finished: 0
summary = 161456 in 00:03:06 =  867.1/s Avg:   340 Min:    10 Max:  1888 Err:     0 (0.00%)
summary +  26405 in 00:00:30 =  880.2/s Avg:   340 Min:    14 Max:  1751 Err:     0 (0.00%) Active: 300 Started: 300 Finished: 0
summary = 187861 in 00:03:36 =  868.9/s Avg:   340 Min:    10 Max:  1888 Err:     0 (0.00%)
summary +  25472 in 00:00:30 =  849.1/s Avg:   353 Min:    10 Max:  1510 Err:     0 (0.00%) Active: 300 Started: 300 Finished: 0
summary = 213333 in 00:04:06 =  866.5/s Avg:   342 Min:    10 Max:  1888 Err:     0 (0.00%)
summary +  25840 in 00:00:30 =  861.3/s Avg:   348 Min:    21 Max:  2110 Err:     0 (0.00%) Active: 300 Started: 300 Finished: 0
summary = 239173 in 00:04:36 =  865.9/s Avg:   342 Min:    10 Max:  2110 Err:     0 (0.00%)
summary +  20857 in 00:00:24 =  863.6/s Avg:   347 Min:    17 Max:  1418 Err:     0 (0.00%) Active: 0 Started: 300 Finished: 300
summary = 260030 in 00:05:00 =  865.7/s Avg:   343 Min:    10 Max:  2110 Err:     0 (0.00%)
再来看400并发,压测数据如下:
summary = 159448 in 00:03:09 =  841.9/s Avg:   463 Min:    10 Max: 64279 Err:     0 (0.00%)
summary +  26222 in 00:00:30 =  874.0/s Avg:   466 Min:    13 Max: 127180 Err:     2 (0.01%) Active: 400 Started: 400 Finished: 0
summary = 185670 in 00:03:39 =  846.3/s Avg:   463 Min:    10 Max: 127180 Err:     2 (0.00%)
summary +  26438 in 00:00:30 =  881.2/s Avg:   454 Min:    17 Max: 63439 Err:     0 (0.00%) Active: 400 Started: 400 Finished: 0
summary = 212108 in 00:04:09 =  850.5/s Avg:   462 Min:    10 Max: 127180 Err:     2 (0.00%)
summary +  25504 in 00:00:30 =  840.4/s Avg:   461 Min:    15 Max: 31703 Err:     0 (0.00%) Active: 400 Started: 400 Finished: 0
summary = 237612 in 00:04:40 =  849.4/s Avg:   462 Min:    10 Max: 127180 Err:     2 (0.00%)
summary +  18341 in 00:00:35 =  527.9/s Avg:   478 Min:    12 Max: 127181 Err:     1 (0.01%) Active: 10 Started: 400 Finished: 390
summary = 255953 in 00:05:14 =  813.9/s Avg:   463 Min:    10 Max: 127181 Err:     3 (0.00%)
summary +      9 in 00:00:38 =    0.2/s Avg: 56166 Min: 31111 Max: 127297 Err:     1 (11.11%) Active: 0 Started: 400 Finished: 400
summary = 255962 in 00:05:53 =  725.2/s Avg:   465 Min:    10 Max: 127297 Err:     4 (0.00%)
从上面可以看出,在200并发下,tps,rt:
summary = 256461 in 00:05:00 = 854.2/s Avg: 231 Min: 9 Max: 2292 Err: 0 (0.00%)
在300并发的时候,tps,rt:
summary = 260030 in 00:05:00 = 865.7/s Avg: 343 Min: 10 Max: 2110 Err: 0 (0.00%)
在300并发的时候,请求虽然增加12,但同时延迟增加了,110ms,当并发为400时,tps降低140,同时延时增加120ms。 从上面可以看出,接口在200的并发情况下,tps,rt:表现较好,支持最大并发为300。
再来看接口最慢RT时间:
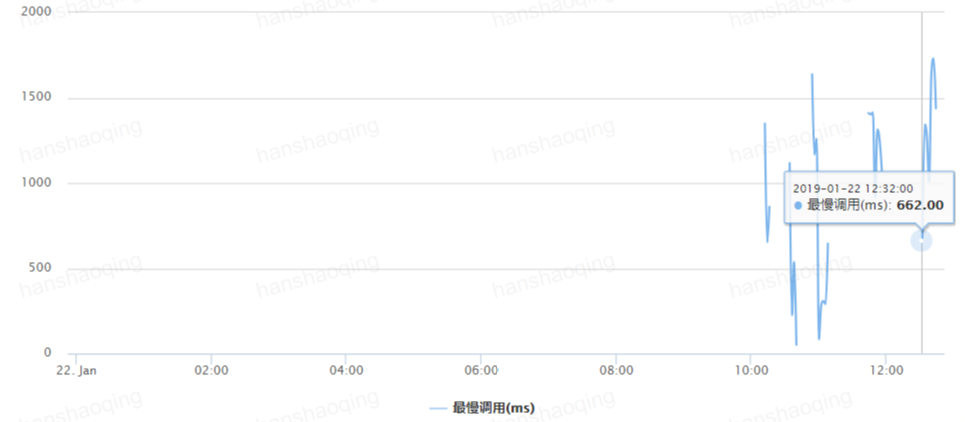 在200,300,400并发的情况下,最慢RT的下面分别为:913,662,1006ms。这个我们配置Hystrix参数的时候,会用到。
下面我们测试Hystrix参数配置下的接口性能,一下所有测试为200并发。
Hystrix限流测试
一般情况下,我们会考虑使用根据最大并发去设置参数,一般如下:
@HystrixCommand(fallbackMethod = "noticesFallBack",
            threadPoolProperties = {
                    @HystrixProperty(name = "coreSize", value = "20"),
                    @HystrixProperty(name = "maximumSize", value = "300"),
                    @HystrixProperty(name = "maxQueueSize", value = "200"),
                    @HystrixProperty(name = "queueSizeRejectionThreshold", value = "200"),
                    @HystrixProperty(name = "allowMaximumSizeToDivergeFromCoreSize", value = "true") // 默认false, 如果不设置该参数maximumSize=coreSize
            },
            commandProperties = {
                    @HystrixProperty(name = "circuitBreaker.errorThresholdPercentage", value = "20"),   //(出错百分比阈值,当达到此阈值后,开始短路。默认50%)
                    @HystrixProperty(name = "circuitBreaker.requestVolumeThreshold", value = "40"),      // 在统计数据之前,必须在10秒内发出3个请求。  默认是20
                    @HystrixProperty(name = "circuitBreaker.sleepWindowInMilliseconds", value = "8000"), //(短路多久以后开始尝试是否恢复,默认5s)
                    @HystrixProperty(name = "execution.timeout.enabled", value = "false"),               //该方法不做超时校验
                    @HystrixProperty(name = "fallback.isolation.semaphore.maxConcurrentRequests", value = "100")    //执行fallback方法的semaphore数量
            })
压测结果:
summary = 137472 in 00:02:57 =  776.4/s Avg:   253 Min:    15 Max:  3113 Err:     0 (0.00%)
summary +  24784 in 00:00:30 =  826.1/s Avg:   241 Min:    17 Max:   905 Err:     0 (0.00%) Active: 200 Started: 200 Finished: 0
summary = 162256 in 00:03:27 =  783.6/s Avg:   251 Min:    15 Max:  3113 Err:     0 (0.00%)
summary +  23633 in 00:00:30 =  787.6/s Avg:   252 Min:    18 Max:  1250 Err:     0 (0.00%) Active: 200 Started: 200 Finished: 0
summary = 185889 in 00:03:57 =  784.1/s Avg:   251 Min:    15 Max:  3113 Err:     0 (0.00%)
summary +  23812 in 00:00:30 =  793.9/s Avg:   253 Min:    16 Max:  1239 Err:     0 (0.00%) Active: 200 Started: 200 Finished: 0
summary = 209701 in 00:04:27 =  785.2/s Avg:   251 Min:    15 Max:  3113 Err:     0 (0.00%)
summary +  24417 in 00:00:30 =  813.8/s Avg:   245 Min:    23 Max:  1228 Err:     0 (0.00%) Active: 200 Started: 200 Finished: 0
summary = 234118 in 00:04:57 =  788.1/s Avg:   251 Min:    15 Max:  3113 Err:     0 (0.00%)
summary +   2281 in 00:00:03 =  710.6/s Avg:   279 Min:    15 Max:   887 Err:     0 (0.00%) Active: 0 Started: 200 Finished: 200
summary = 236399 in 00:05:00 =  787.2/s Avg:   251 Min:    15 Max:  3113 Err:     0 (0.00%)
从上面可以看出,与未加限流200并发的测试相比,响应(231->251ms)和TPS(854.2->787.2), 添加限流,tps降低,延时增加。
根据前文中提到的Hystrix参数配置策略,线程池配置策略,及接口原始性能测试数据,
200并发,tps,rt:
summary = 256461 in 00:05:00 = 854.2/s Avg: 231 Min: 9 Max: 2292 Err: 0 (0.00%)
并发数:200,300,400
最慢调用下限:913,662,1006ms
我们调整配置如下:
核心线程数: 854.20.231=197.3=198=200
核心线程数与缓冲线程为8:2原则
最大线程数:200/810=250
队列长度与最大线程数也为8:2原则,
队列长度:200
容忍错误率为:10%
熔断器恢复时间,默认5s
超时时间设为:700ms, 200,300,400并发下的最慢调用下限
降级并发量为最大线程数250*错误容忍率10%=25
具体配置如下:
 @HystrixCommand(fallbackMethod = "noticesFallBack",
            threadPoolProperties = {
                    @HystrixProperty(name = "coreSize", value = "200"),
                    @HystrixProperty(name = "maximumSize", value = "250"),
                    @HystrixProperty(name = "maxQueueSize", value = "200"),
                    @HystrixProperty(name = "queueSizeRejectionThreshold", value = "200"),
                    @HystrixProperty(name = "allowMaximumSizeToDivergeFromCoreSize", value = "true") // 默认false, 如果不设置该参数maximumSize=coreSize
            },
            commandProperties = {
                    @HystrixProperty(name = "circuitBreaker.errorThresholdPercentage", value = "10"),   //(出错百分比阈值,当达到此阈值后,开始短路。默认50%)
                    @HystrixProperty(name = "circuitBreaker.requestVolumeThreshold", value = "20"),      // 在统计数据之前,必须在10秒内发出3个请求。  默认是20
                    @HystrixProperty(name = "circuitBreaker.sleepWindowInMilliseconds", value = "5000"), //(短路多久以后开始尝试是否恢复,默认5s)
                    @HystrixProperty(name = "execution.timeout.enabled", value = "true"),
                    @HystrixProperty(name = "execution.isolation.thread.timeoutInMilliseconds", value = "700"), //线程执行超时时间,默认为1s,应该可满足99.5%的请求
                    @HystrixProperty(name = "fallback.isolation.semaphore.maxConcurrentRequests", value = "25")    //执行fallback方法的semaphore数量
})
压测结果:
summary = 264340 in 00:04:59 =  883.3/s Avg:   224 Min:     6 Max:  2579 Err:  1859 (0.70%)
summary +    919 in 00:00:01 = 1016.6/s Avg:   201 Min:    11 Max:   547 Err:     0 (0.00%) Active: 0 Started: 200 Finished: 200
summary = 265259 in 00:05:00 =  883.7/s Avg:   224 Min:     6 Max:  2579 Err:  1859 (0.70%)
从上面可以看出,在默认配合的情况下,经过参数调优后,响应(231->224ms)和TPS(854.2->883.7),tps提高,延时降低。错误率为0.70%,在可接受的范围之内。
我们设置最大队列为250,配置如下:
@HystrixCommand(fallbackMethod = "noticesFallBack",
            threadPoolProperties = {
                    @HystrixProperty(name = "coreSize", value = "200"),
                    @HystrixProperty(name = "maximumSize", value = "250"),
                    @HystrixProperty(name = "maxQueueSize", value = "250"),
                    @HystrixProperty(name = "queueSizeRejectionThreshold", value = "200"),
                    @HystrixProperty(name = "allowMaximumSizeToDivergeFromCoreSize", value = "true") // 默认false, 如果不设置该参数maximumSize=coreSize
            },
            commandProperties = {
                    @HystrixProperty(name = "circuitBreaker.errorThresholdPercentage", value = "10"),   //(出错百分比阈值,当达到此阈值后,开始短路。默认50%)
                    @HystrixProperty(name = "circuitBreaker.requestVolumeThreshold", value = "20"),      // 在统计数据之前,必须在10秒内发出3个请求。  默认是20
                    @HystrixProperty(name = "circuitBreaker.sleepWindowInMilliseconds", value = "5000"), //(短路多久以后开始尝试是否恢复,默认5s)
                    @HystrixProperty(name = "execution.timeout.enabled", value = "true"),
                    @HystrixProperty(name = "execution.isolation.thread.timeoutInMilliseconds", value = "700"), //线程执行超时时间,默认为1s,应该可满足99.5%的请求
                    @HystrixProperty(name = "fallback.isolation.semaphore.maxConcurrentRequests", value = "25")    //执行fallback方法的semaphore数量
})
压测结果:
summary = 232655 in 00:04:24 =  880.1/s Avg:   224 Min:     2 Max: 15840 Err:  8475 (3.64%)
summary +  26494 in 00:00:30 =  883.2/s Avg:   226 Min:    11 Max:  2403 Err:     0 (0.00%) Active: 200 Started: 200 Finished: 0
summary = 259149 in 00:04:54 =  880.4/s Avg:   224 Min:     2 Max: 15840 Err:  8475 (3.27%)
summary +   5615 in 00:00:06 =  959.0/s Avg:   209 Min:    13 Max:  1085 Err:     0 (0.00%) Active: 0 Started: 200 Finished: 200
summary = 264764 in 00:05:00 =  881.9/s Avg:   224 Min:     2 Max: 15840 Err:  8475 (3.20%)
从上面可以看出,响应时间(224->224ms)和TPS(883.7->881.9),延迟不变,tps提高大约2,可以几乎不计,但错误率提升(0.70%->3.20%)。可以理解为,当队列大小与 最大线程相同时,带来的错误率的影响远大于带来的tps贡献。还不如对队列大小稍微限制,缓解线程池的压力。
我们在设置超时时间为900ms。
@HystrixCommand(fallbackMethod = "noticesFallBack",
            threadPoolProperties = {
                    @HystrixProperty(name = "coreSize", value = "200"),
                    @HystrixProperty(name = "maximumSize", value = "250"),
                    @HystrixProperty(name = "maxQueueSize", value = "200"),
                    @HystrixProperty(name = "queueSizeRejectionThreshold", value = "200"),
                    @HystrixProperty(name = "allowMaximumSizeToDivergeFromCoreSize", value = "true") // 默认false, 如果不设置该参数maximumSize=coreSize
            },
            commandProperties = {
                    @HystrixProperty(name = "circuitBreaker.errorThresholdPercentage", value = "10"),   //(出错百分比阈值,当达到此阈值后,开始短路。默认50%)
                    @HystrixProperty(name = "circuitBreaker.requestVolumeThreshold", value = "20"),      // 在统计数据之前,必须在10秒内发出3个请求。  默认是20
                    @HystrixProperty(name = "circuitBreaker.sleepWindowInMilliseconds", value = "5000"), //(短路多久以后开始尝试是否恢复,默认5s)
                    @HystrixProperty(name = "execution.timeout.enabled", value = "true"),
                    @HystrixProperty(name = "execution.isolation.thread.timeoutInMilliseconds", value = "900"), //线程执行超时时间,默认为1s,应该可满足99.5%的请求
                    @HystrixProperty(name = "fallback.isolation.semaphore.maxConcurrentRequests", value = "25")    //执行fallback方法的semaphore数量
            })
压测结果:
summary +  26996 in 00:00:30 =  899.9/s Avg:   222 Min:    11 Max:  1421 Err:     4 (0.01%) Active: 200 Started: 200 Finished: 0
summary = 243936 in 00:04:59 =  817.0/s Avg:   242 Min:     2 Max: 14465 Err:  9052 (3.71%)
summary +    950 in 00:00:02 =  559.5/s Avg:   362 Min:    20 Max:  1313 Err:     0 (0.00%) Active: 0 Started: 200 Finished: 200
summary = 244886 in 00:05:00 =  815.6/s Avg:   242 Min:     2 Max: 14465 Err:  9052 (3.70%)
从上面可以看出,响应(224->242ms)和TPS(883.7->815.6),当执行超时时间增加时(execution.isolation.thread.timeoutInMilliseconds), 并反而增加了延时,降低了tps,同时错误率增加。原因应该为,当超时时间变大,这些线程占用的资源更久,进而影响tps、rt,及错误率。
从以上分析来看,最大线程数和超时时间也不是越多也好。
再来看,测试过程中的cpu,load,和mem,
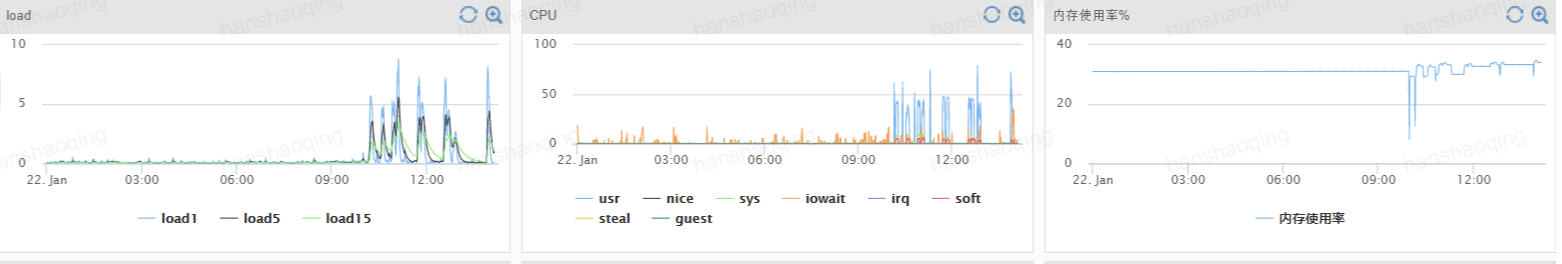 从上面可以看出,添加Hystrix限流,cpu,load,和mem并没有增加多少,相对率给分布式应用带来安全和性能的益处,远大于负载开销。
总结
根据Hystrix参数的配置说明和线程池的配置策略,具体参数配置规则如下:
核心线程数=峰值每秒的请求数健康状况下99%的响应时间
缓冲线程=核心线程数2/8
最大线程数=核心线程数+缓冲线程
队列长度=核心线程数
容忍错误率为:10%
熔断器恢复时间,默认5s
超时时间设为: 可满足99.5%的访问延时,同时延时在可接受范围之内
降级并发量=最大线程数*错误容忍率
具体参数配置,不同的场景和应用,有不同的tradeoffs方案, 以实际压测数据为准。如果在真是环境中,如果配置失效,可以动态的调整配置参数。